Which app is it?
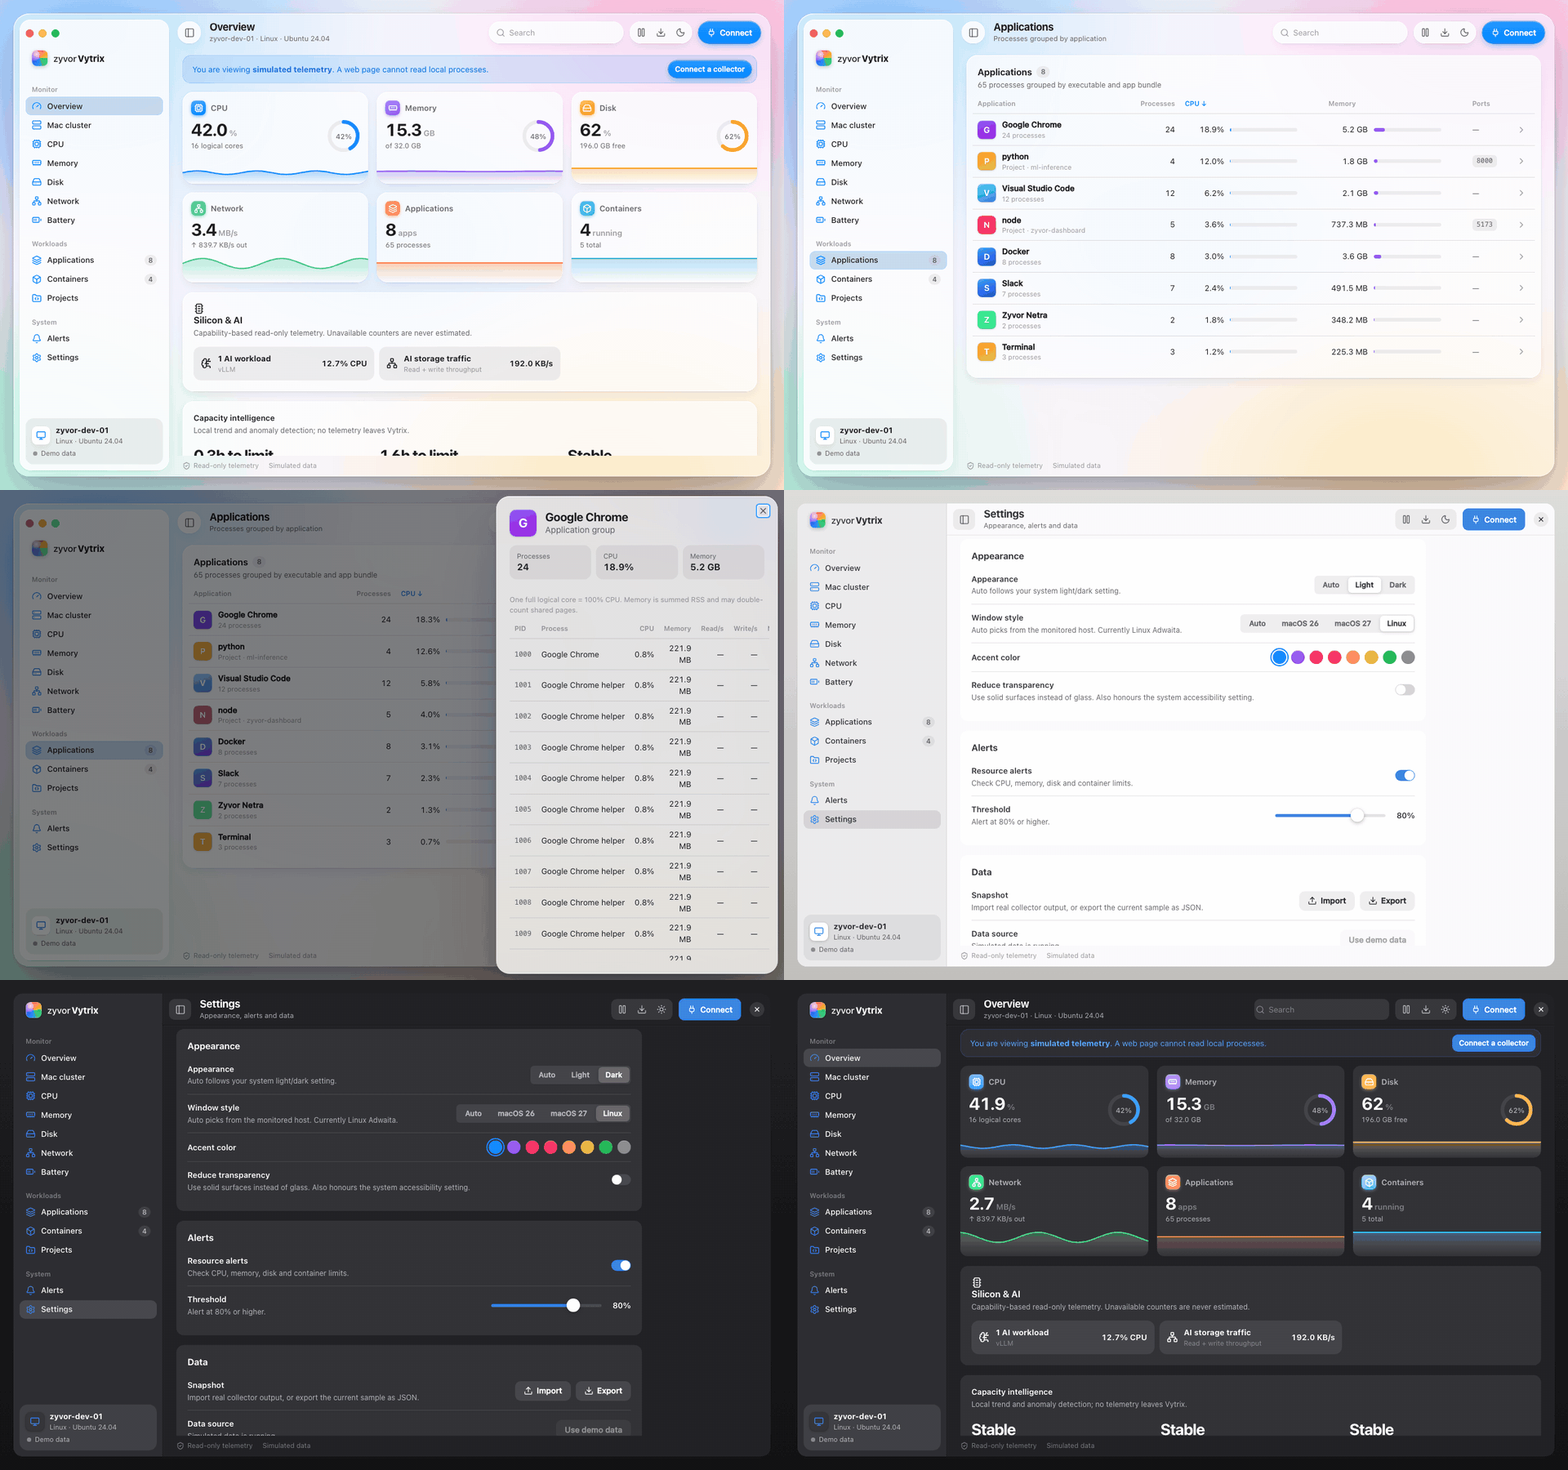
Processes grouped by executable or .app bundle, with CPU and memory per application and a process sheet one click away.
Zyvor · system monitor
A read-only system activity monitor for macOS and Linux. Applications grouped the way you think about them, processes, listening ports, project folders, and Docker and Podman containers, in a Liquid Glass or Adwaita window.
Try the live demoDownload for MacRun it yourself
Every screenshot is the real app on simulated telemetry. Or open it and click around.
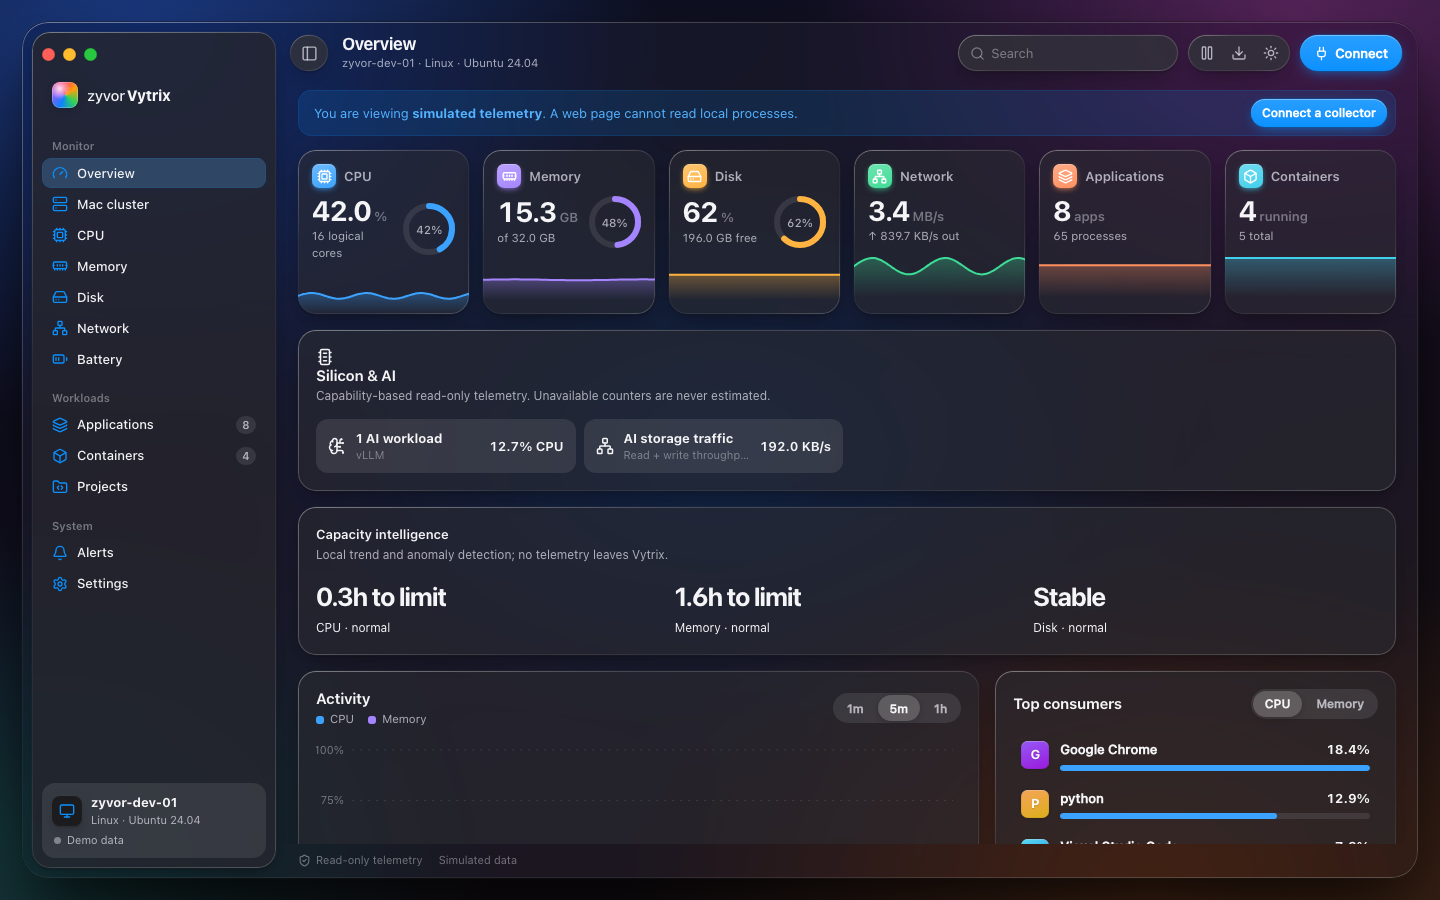
Processes grouped by executable or .app bundle, with CPU and memory per application and a process sheet one click away.
Docker and Podman side by side: state, CPU, memory against its limit, network I/O and published ports, from read-only CLI calls.
Listening ports tied to the application and its project folder, so a stray dev server is easy to find.
Threshold alerts on CPU, memory, disk and containers, with a level you set. No notifications you did not ask for.
Activity history in the tab, and 30 days of samples in a 0600 SQLite file that the collector serves over an authenticated API.
Bearer token, exact CORS origin, HTTPS. No mutations in the API: it cannot do anything to the machine.
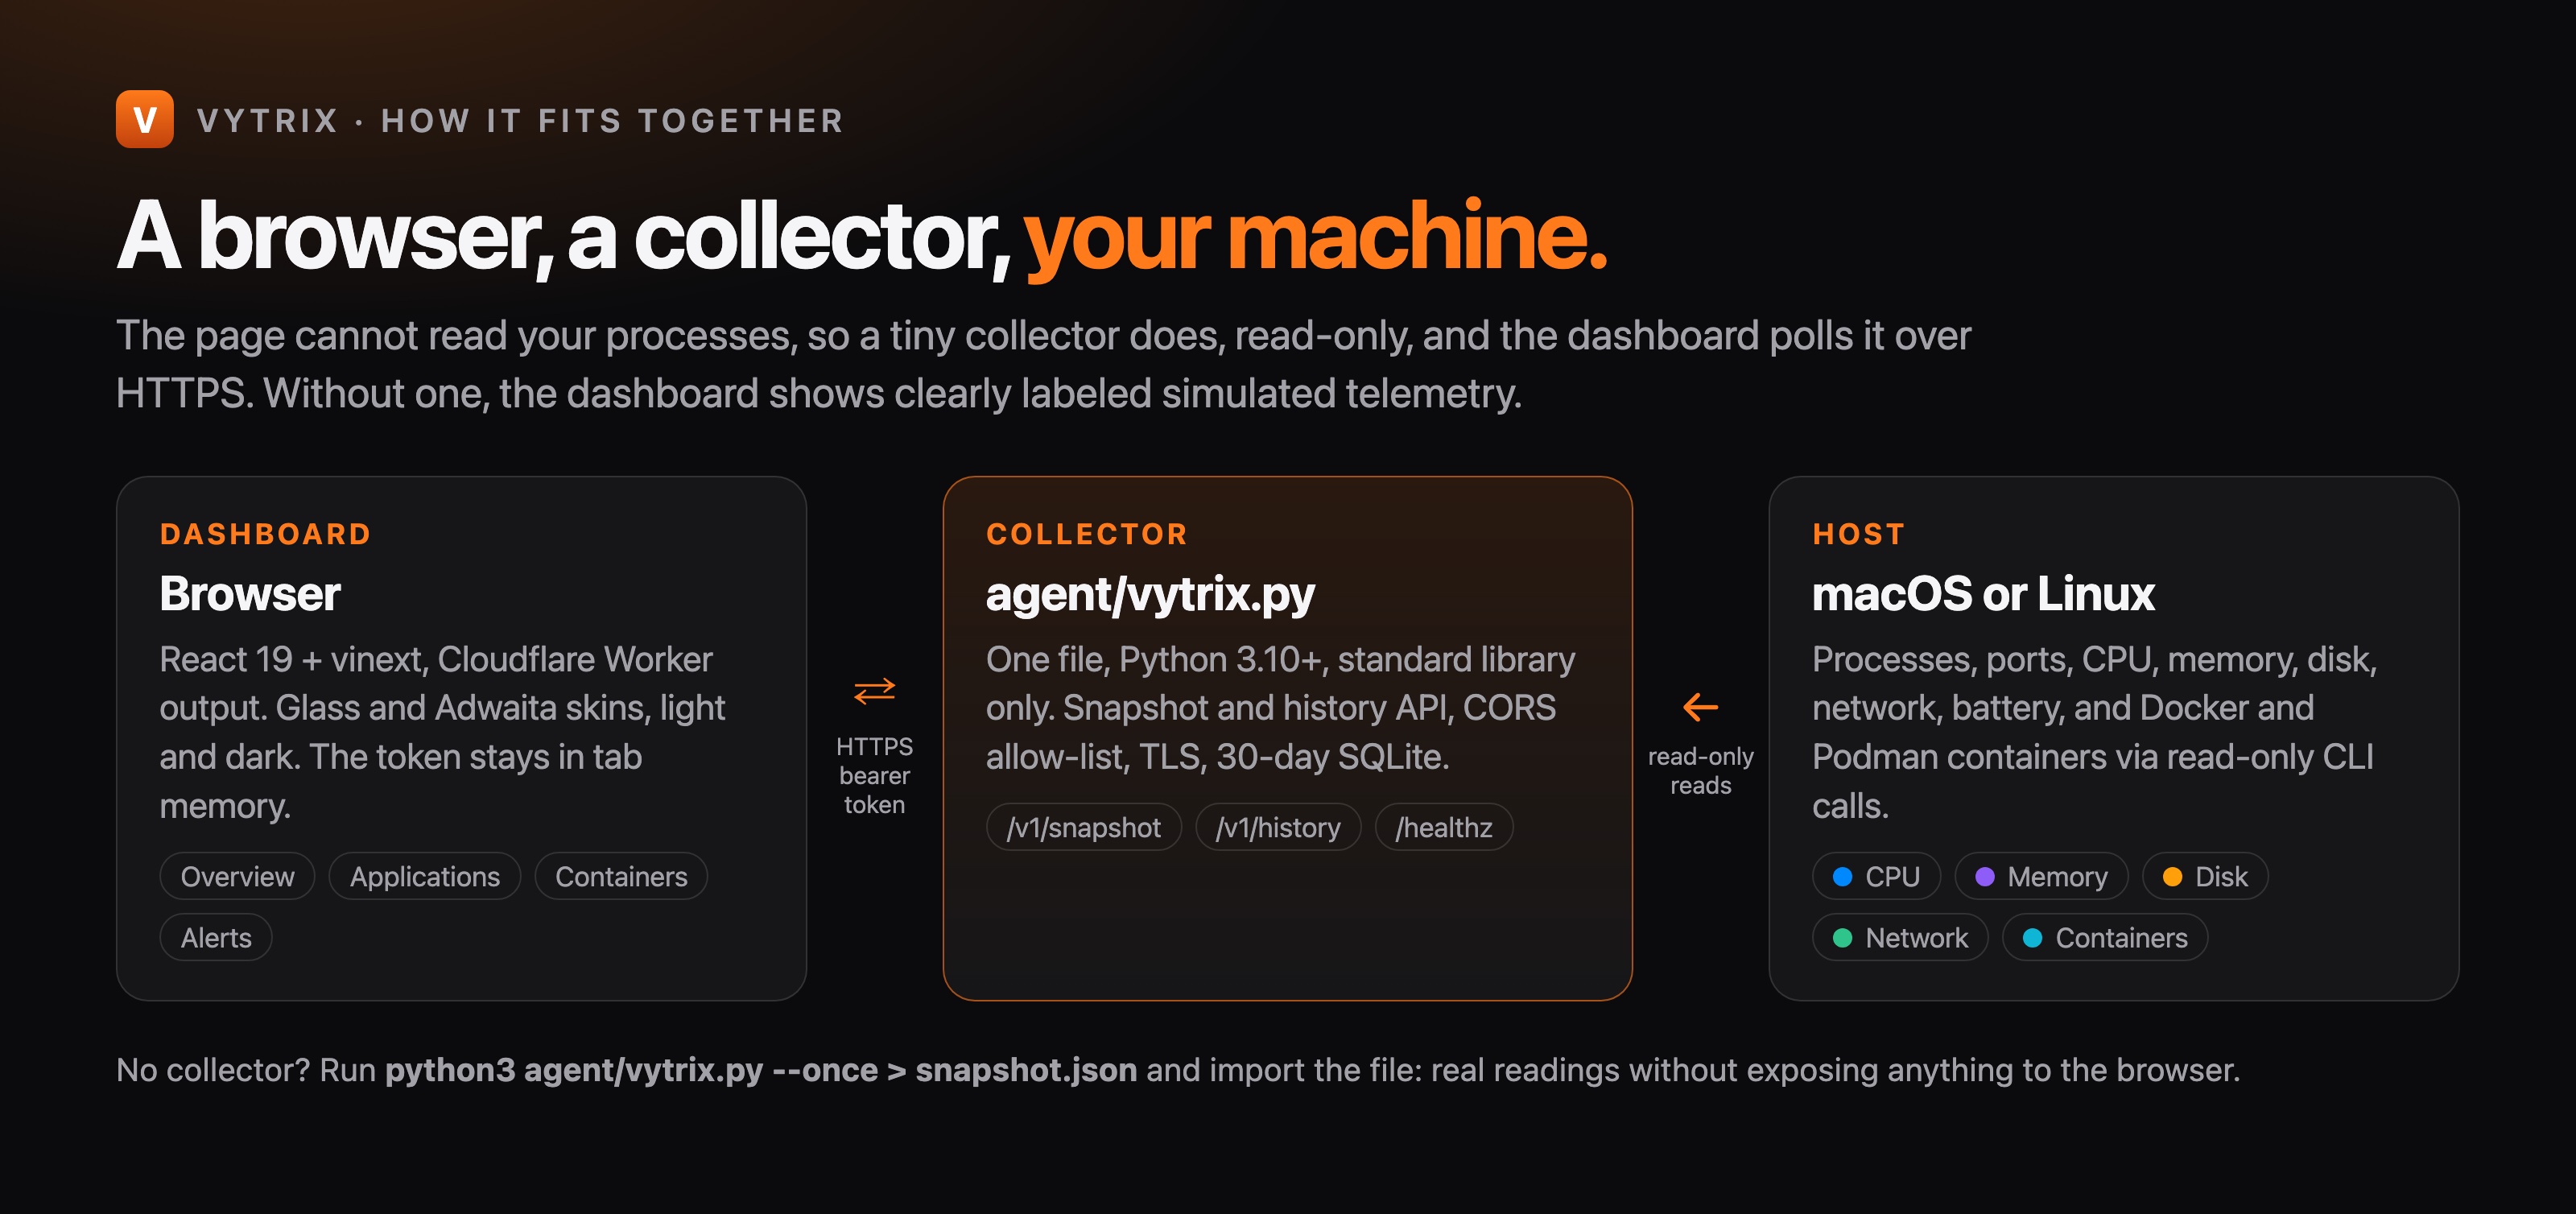
A web page cannot read your processes, so a small collector does, read-only, and the dashboard polls it over HTTPS. Without one, the dashboard shows clearly labeled simulated telemetry.
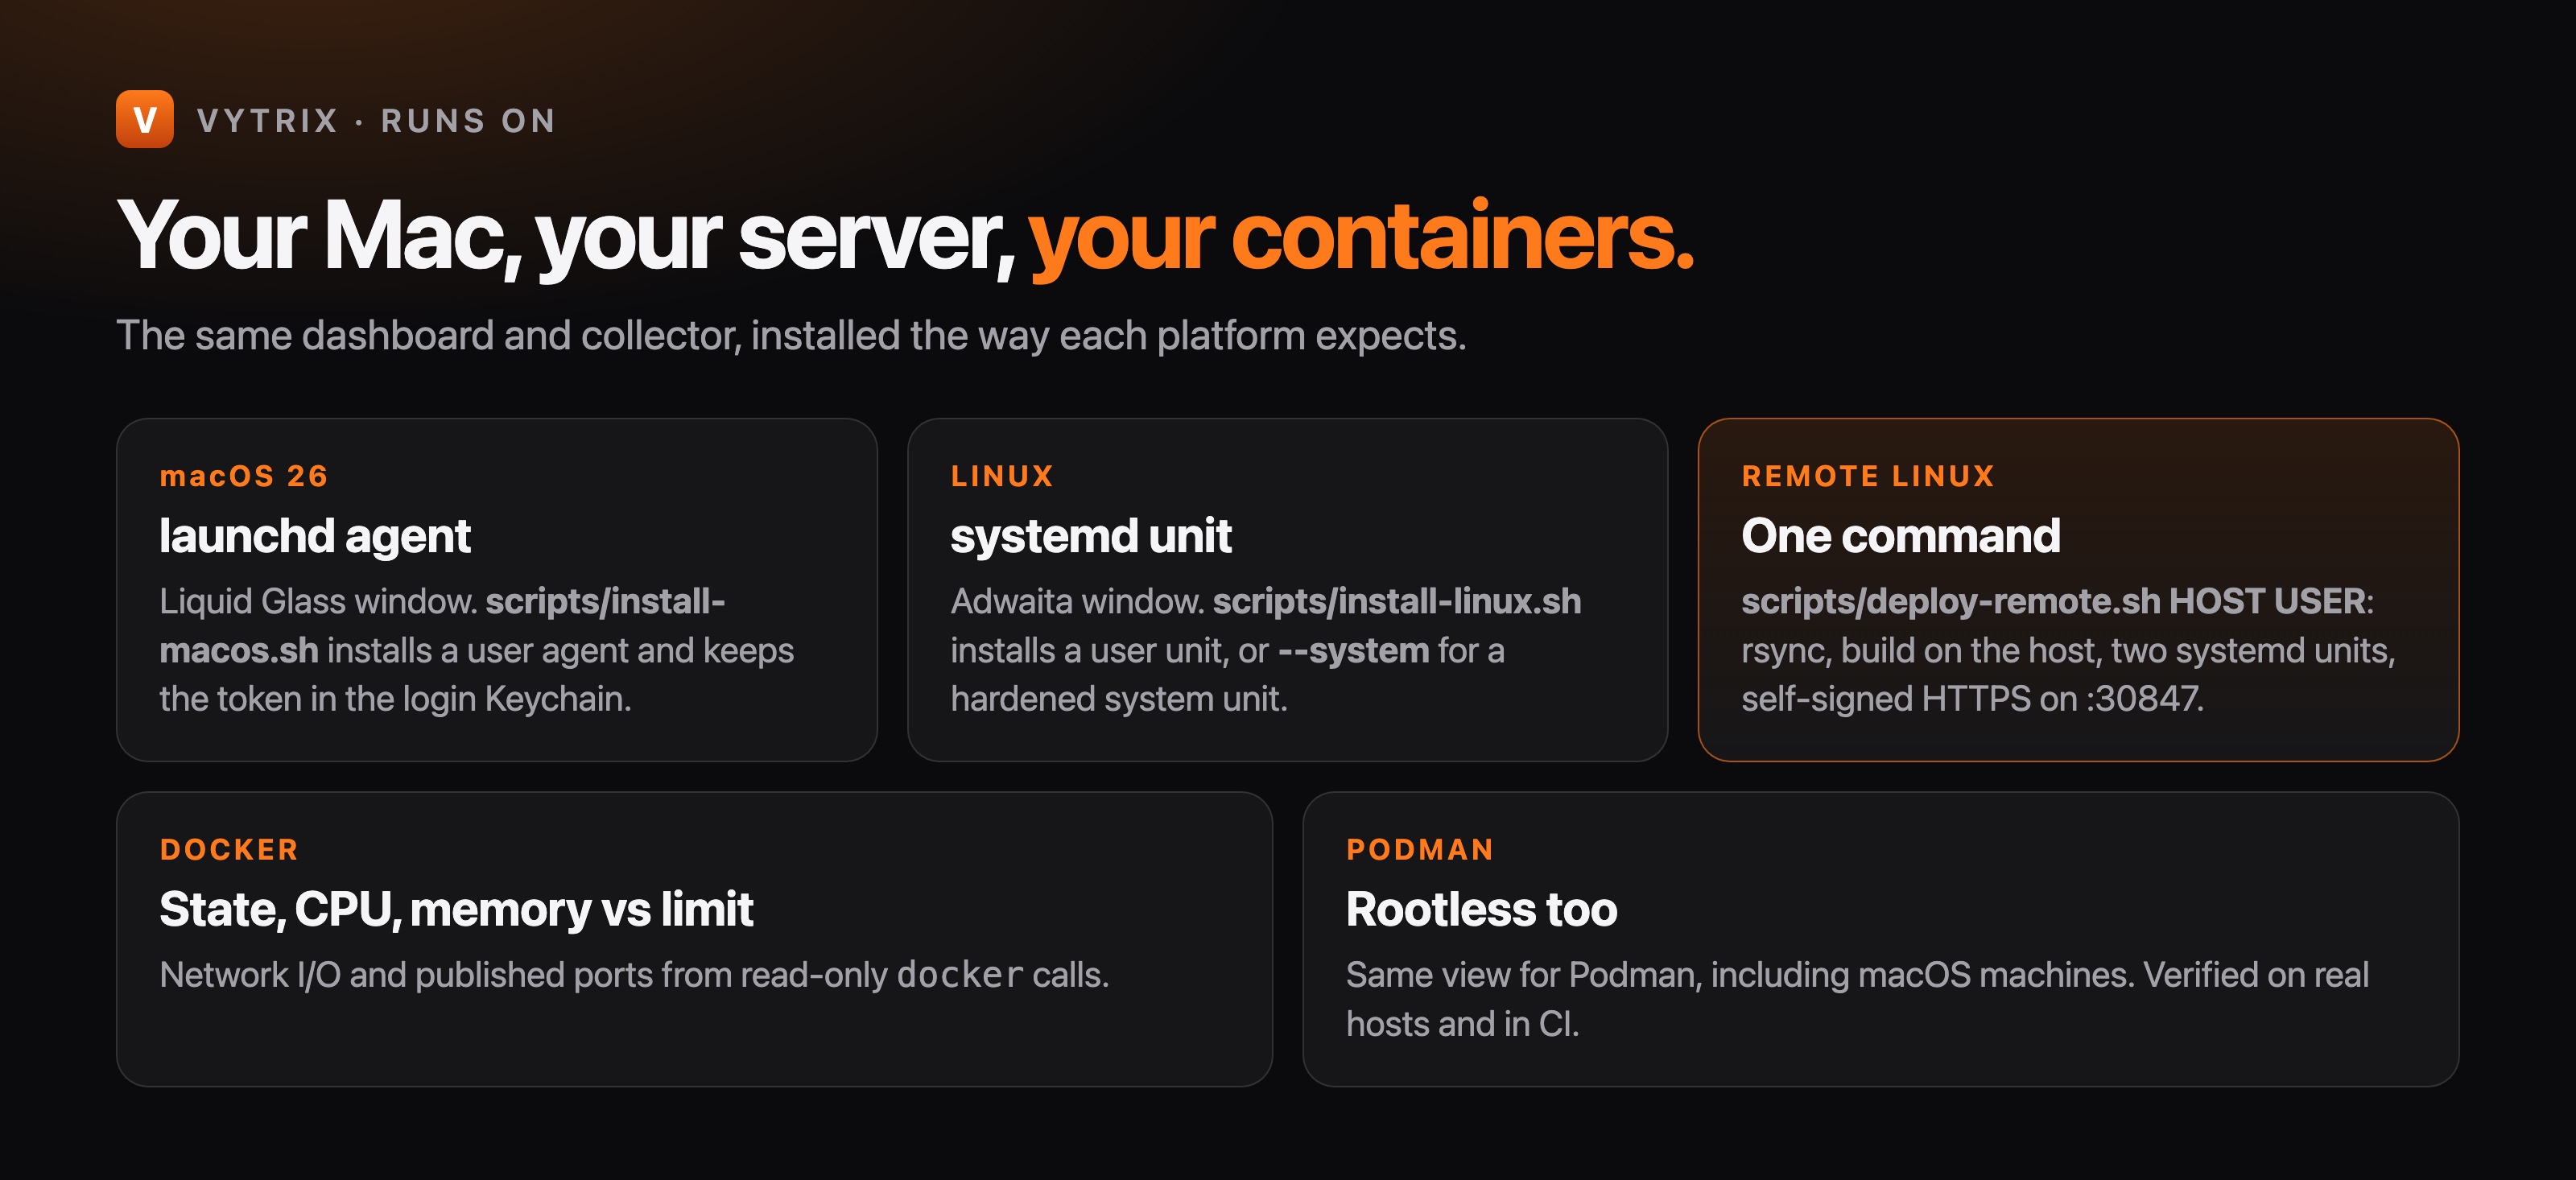
The native SwiftUI app with the collector bundled: it starts it on loopback with a token held in memory, read-only like everything else. Signed with a Developer ID but not yet notarized: on first launch, open System Settings → Privacy & Security and choose Open Anyway. Apple silicon, macOS 26 or newer; the collector needs Python 3.10+ (Homebrew's, since the system /usr/bin/python3 is 3.9).
Download Vytrix 0.3.0 (DMG)Release notes, SHA-256 and the collector archive
Node 22.13 or newer. npx pnpm@11.25.0 … works without installing pnpm.
git clone https://github.com/zyvorai/zyvor-vytrix.git && cd zyvor-vytrix
npx pnpm@11.25.0 install --frozen-lockfile
npx pnpm@11.25.0 dev            # http://localhost:5173, simulated telemetry
Your own readings, offline (Python 3.10+, no root), then Connect → Import collector snapshot:
python3 agent/vytrix.py --once > snapshot.jsonLive telemetry from a collector on this machine:
export VYTRIX_TOKEN="$(python3 -c 'import secrets; print(secrets.token_urlsafe(32))')"
python3 agent/vytrix.py --allow-origin http://localhost:5173./scripts/deploy-remote.sh 203.0.113.10 deploy # HOST USER, or user@hostIt syncs the checkout over SSH, builds it on the host, and installs two systemd units: the dashboard on loopback and the collector on https://HOST:30847 with a self-signed certificate, proxying the dashboard. Open the URL, accept the certificate, Connect, and paste the token. For a Mac or a laptop, scripts/install-macos.sh (launchd, token in the Keychain) and scripts/install-linux.sh (systemd) install the collector as a service.
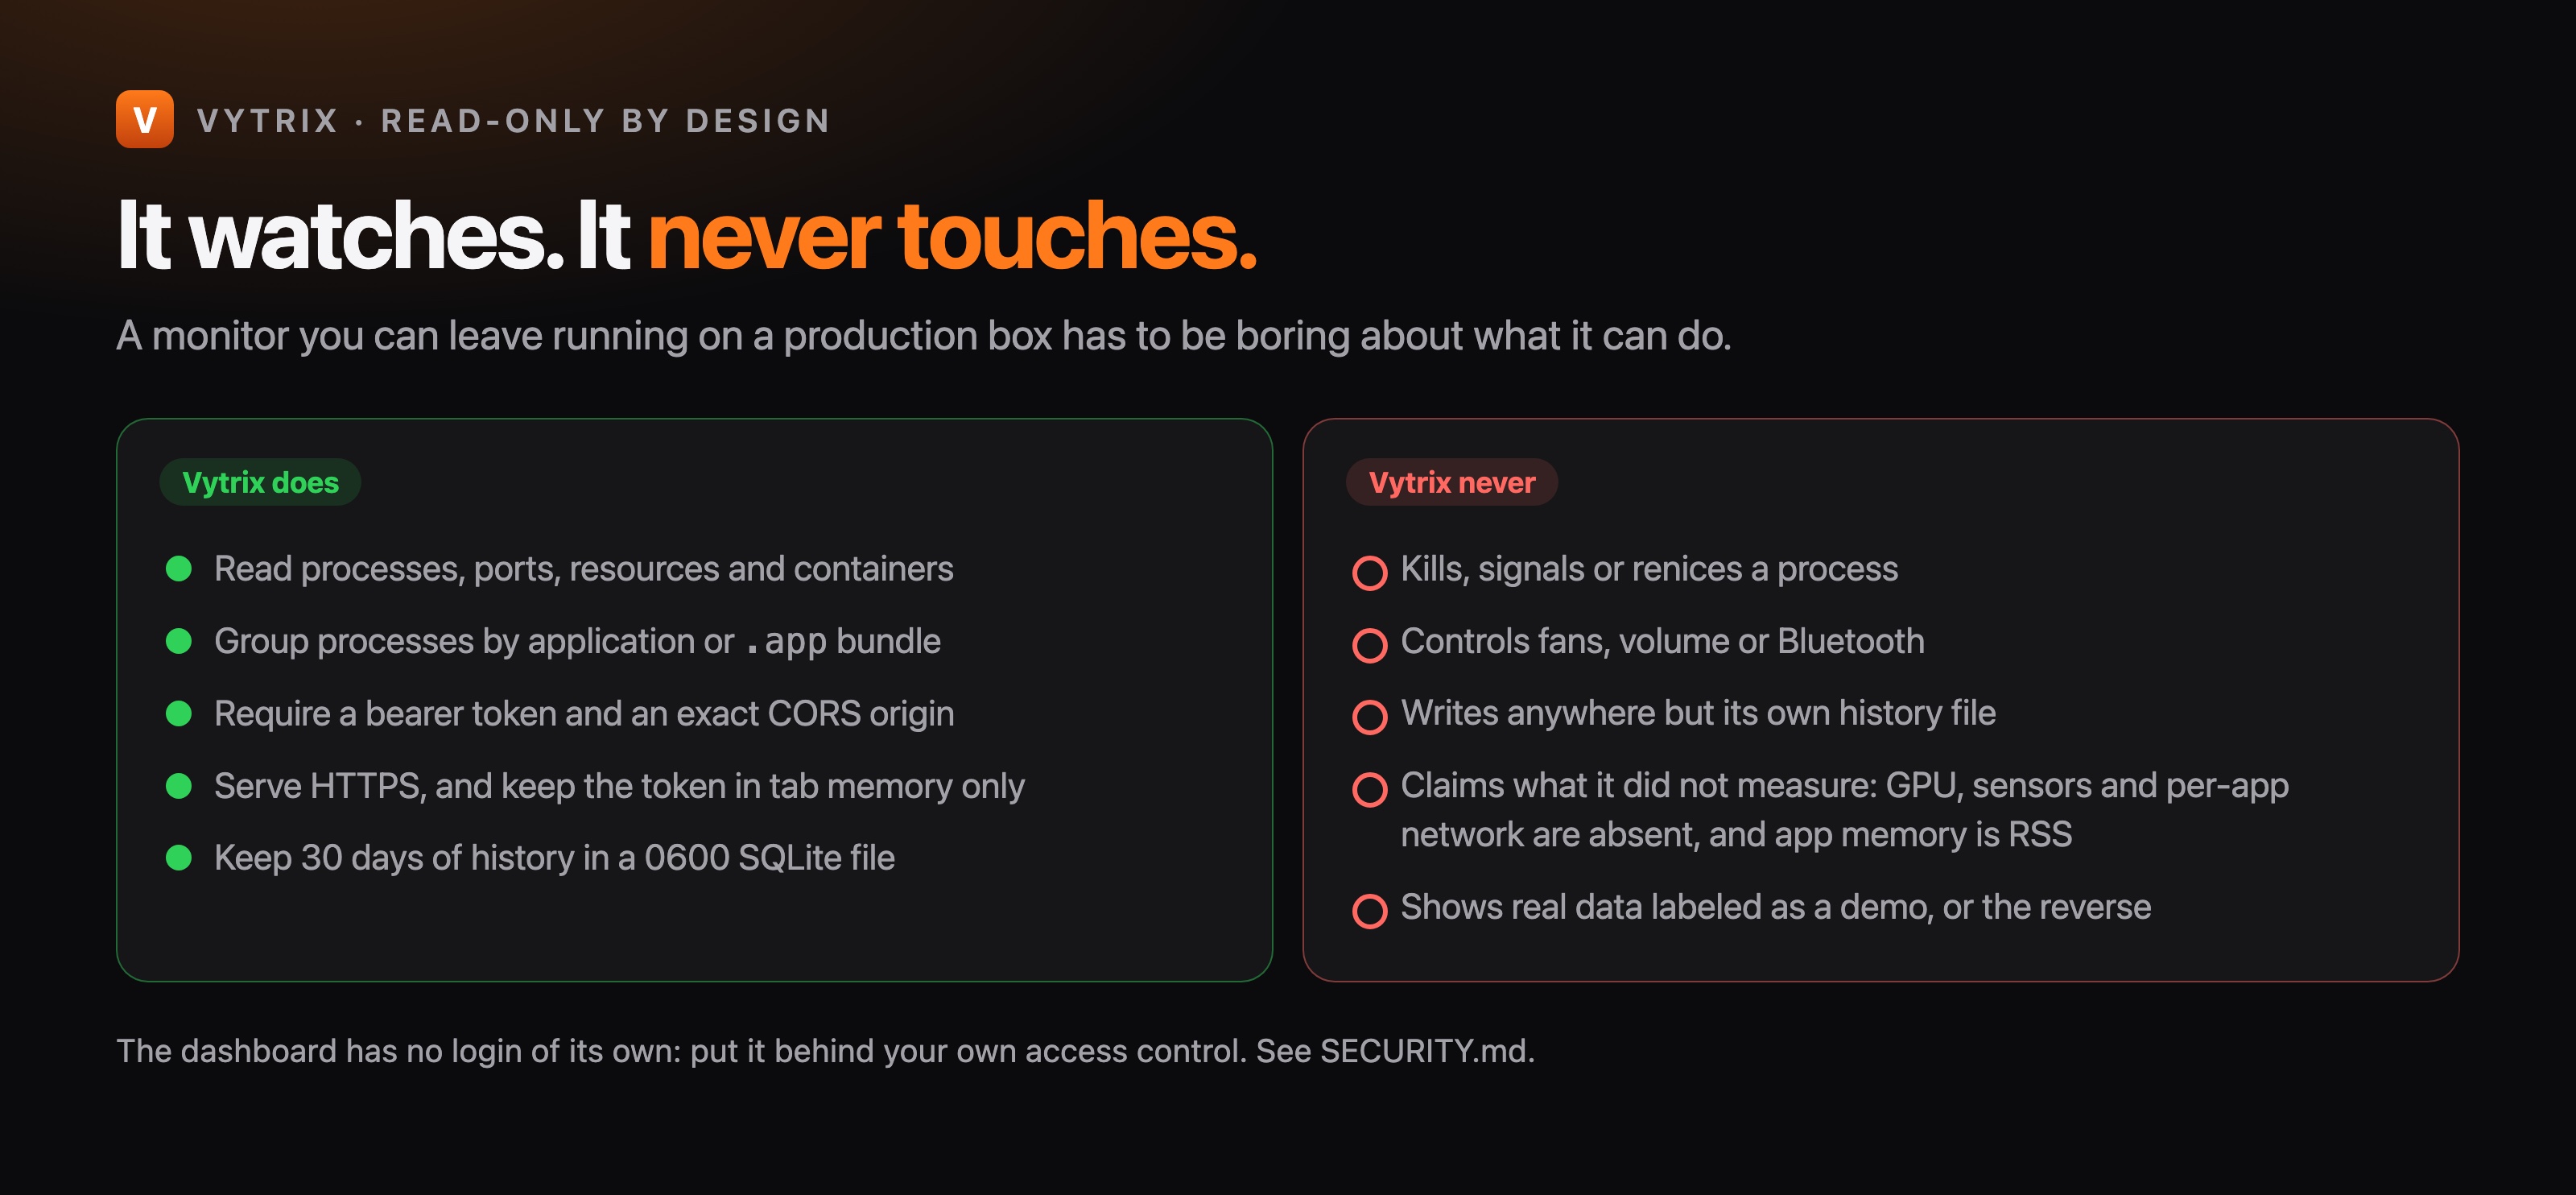
The dashboard has no login of its own: put it behind your own access control. What the collector token protects, and what it does not, is in SECURITY.md.